Published February 3, 2017

During the financial crisis the stock market fell by over -50%. By February 1, 2011, the stock market had recovered about +80% from the market lows. Yet, investors still had not recovered from the losses. In fact, they were still down by more than -15%! Many investors might have wondered: why am I still “underwater”? How can an 80% gain be less than a 50% loss? Chart 1 below sets out the math of this situation.
Chart 1 – Gains needed to offset stock market losses
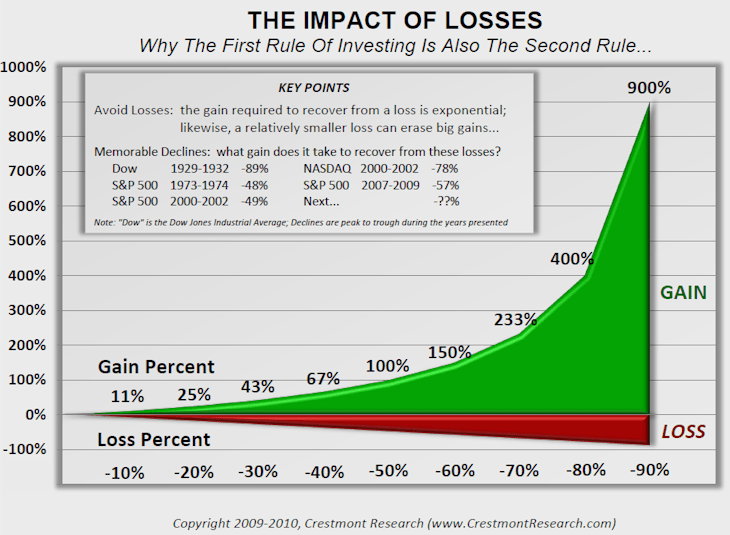
Chart 1 above shows the gain required to offset losses from 0% to 90%. In the chart, losses are indicated on the horizontal axis — from 0% to 90%. The green line/area shows the gain needed to offset each loss — measured on the vertical axis. For example, it takes a 25% gain to recover from a 20% loss. For comparison, the red line just shows the size of the loss in order to emphasize the difference between the size of the loss and the gain required to offset it.
The easiest way to think about this is to imagine that your holdings dropped 100%, i.e., to $0. Would an 100% increase from there get you back to even? Not even close. A 100% increase from $0 is still … $0. Or, suppose your holdings dropped from $10,000 to $5,000 — a 50% decrease. A 50% increase from $5,000 would only get you back to $7,500; you’d need a 100% increase to get you back to $10,000.
In the latter case, the fact that you lost $5,000 does mean that you need to gain $5,000 to get even — as you would expect. However, this $5,000 required gain must be measured against the new starting portfolio of $5,000 rather than the original $10,000 portfolio. As a result, the required percentage gain is ($5,000/$5,000=) 100%.
Another way to use the chart is to determine how large a loss would be needed to erase a given gain. For example, to reverse the earlier example, if you were ahead 100%, what percent would you have to lose to wipe out all of your gains? To find this answer, start at 100% on the vertical axis. Follow the 100% grid-line until it intersects with the green line, and read below on the horizontal axis. As you already know, the answer is 50%.
The moral of this story is that it pays to be careful. If you lose 1% of your investment, it only takes a 1.01% increase to recover. If you lose 10%, it only takes an 11.11% gain to recover. However, as you can see, this is not a linear relationship. The larger the loss, the larger the difference between the percentage loss and the percentage gain required to recover. And the closer your loss gets to 100%, the closer the required offsetting gain gets to infinity! As a result, it is especially important to avoid large losses.
This statement is the driving force behind our approach to investing. By avoiding the large losses, we preserve our investment capital which leaves us in a far better position to take advantage of the market’s next move higher. If we allow the market’s large losses to seriously damage our wealth, we could find ourselves simply running in place – a situation that did indeed happen to investors in the “lost” decade of 2000-2010 where two serious market declines offset all the gains.
Note: the above is a mildly edited version of an article from the financial blog Observations found at observationsandnotes.blogspot.com
Market Update
Stocks opened the week lower with concerns about President Trump’s immigration policy appearing to lead investors to be concerned about a general protectionist tone from the new administration. Broad market indexes slipped -0.6%. Tuesday saw a continued downdraft early in the session with poor earnings from Exxon Mobil (XOM) and United Parcel Service (UPS) keeping investors in a cautious mood. However, buyers returned in the afternoon to push stock indexes back to flat on the day ahead of Apple’s earnings after the market close. Those earnings offered a positive surprise sending the stock +7% higher. The jump in Apple (AAPL) failed to spark a broad rally, however, as stocks closed flat on the day – a negative result given that the market’s heaviest weighted stock was up so strongly. Defensive stock sectors shined bright in Thursday’s session with good earnings from Philip Morris (PM) helping the consumer staples group. Elsewhere investors struggled to gather any momentum. Facebook (FB) shares closed lower despite a big earnings win, for example. Friday brought a different tone with the monthly jobs report coming out not-too-hot, not-too-cold to cheer investors that interest rate rises will not be accelerated though growth remains solid. Another dose of positive news came from President Trump’s order to roll back some of the Dodd-Frank banking regulations. Banks as a group jumped more than +2% on the news while Amazon’s (AMZN) shares sank almost -4% on a perceived earnings miss.
Stocks closed a solid January and kicked off February in positive fashion as well this week with the S&P 500 up +0.75%, the small-cap Russell 2000 gaining +1.35%, and the Nasdaq 100 (QQQ) eking out a +0.27% move after a week of mixed earnings from some of that indexes largest companies.
Warm wishes and until next week.